All buoy tracks in one map
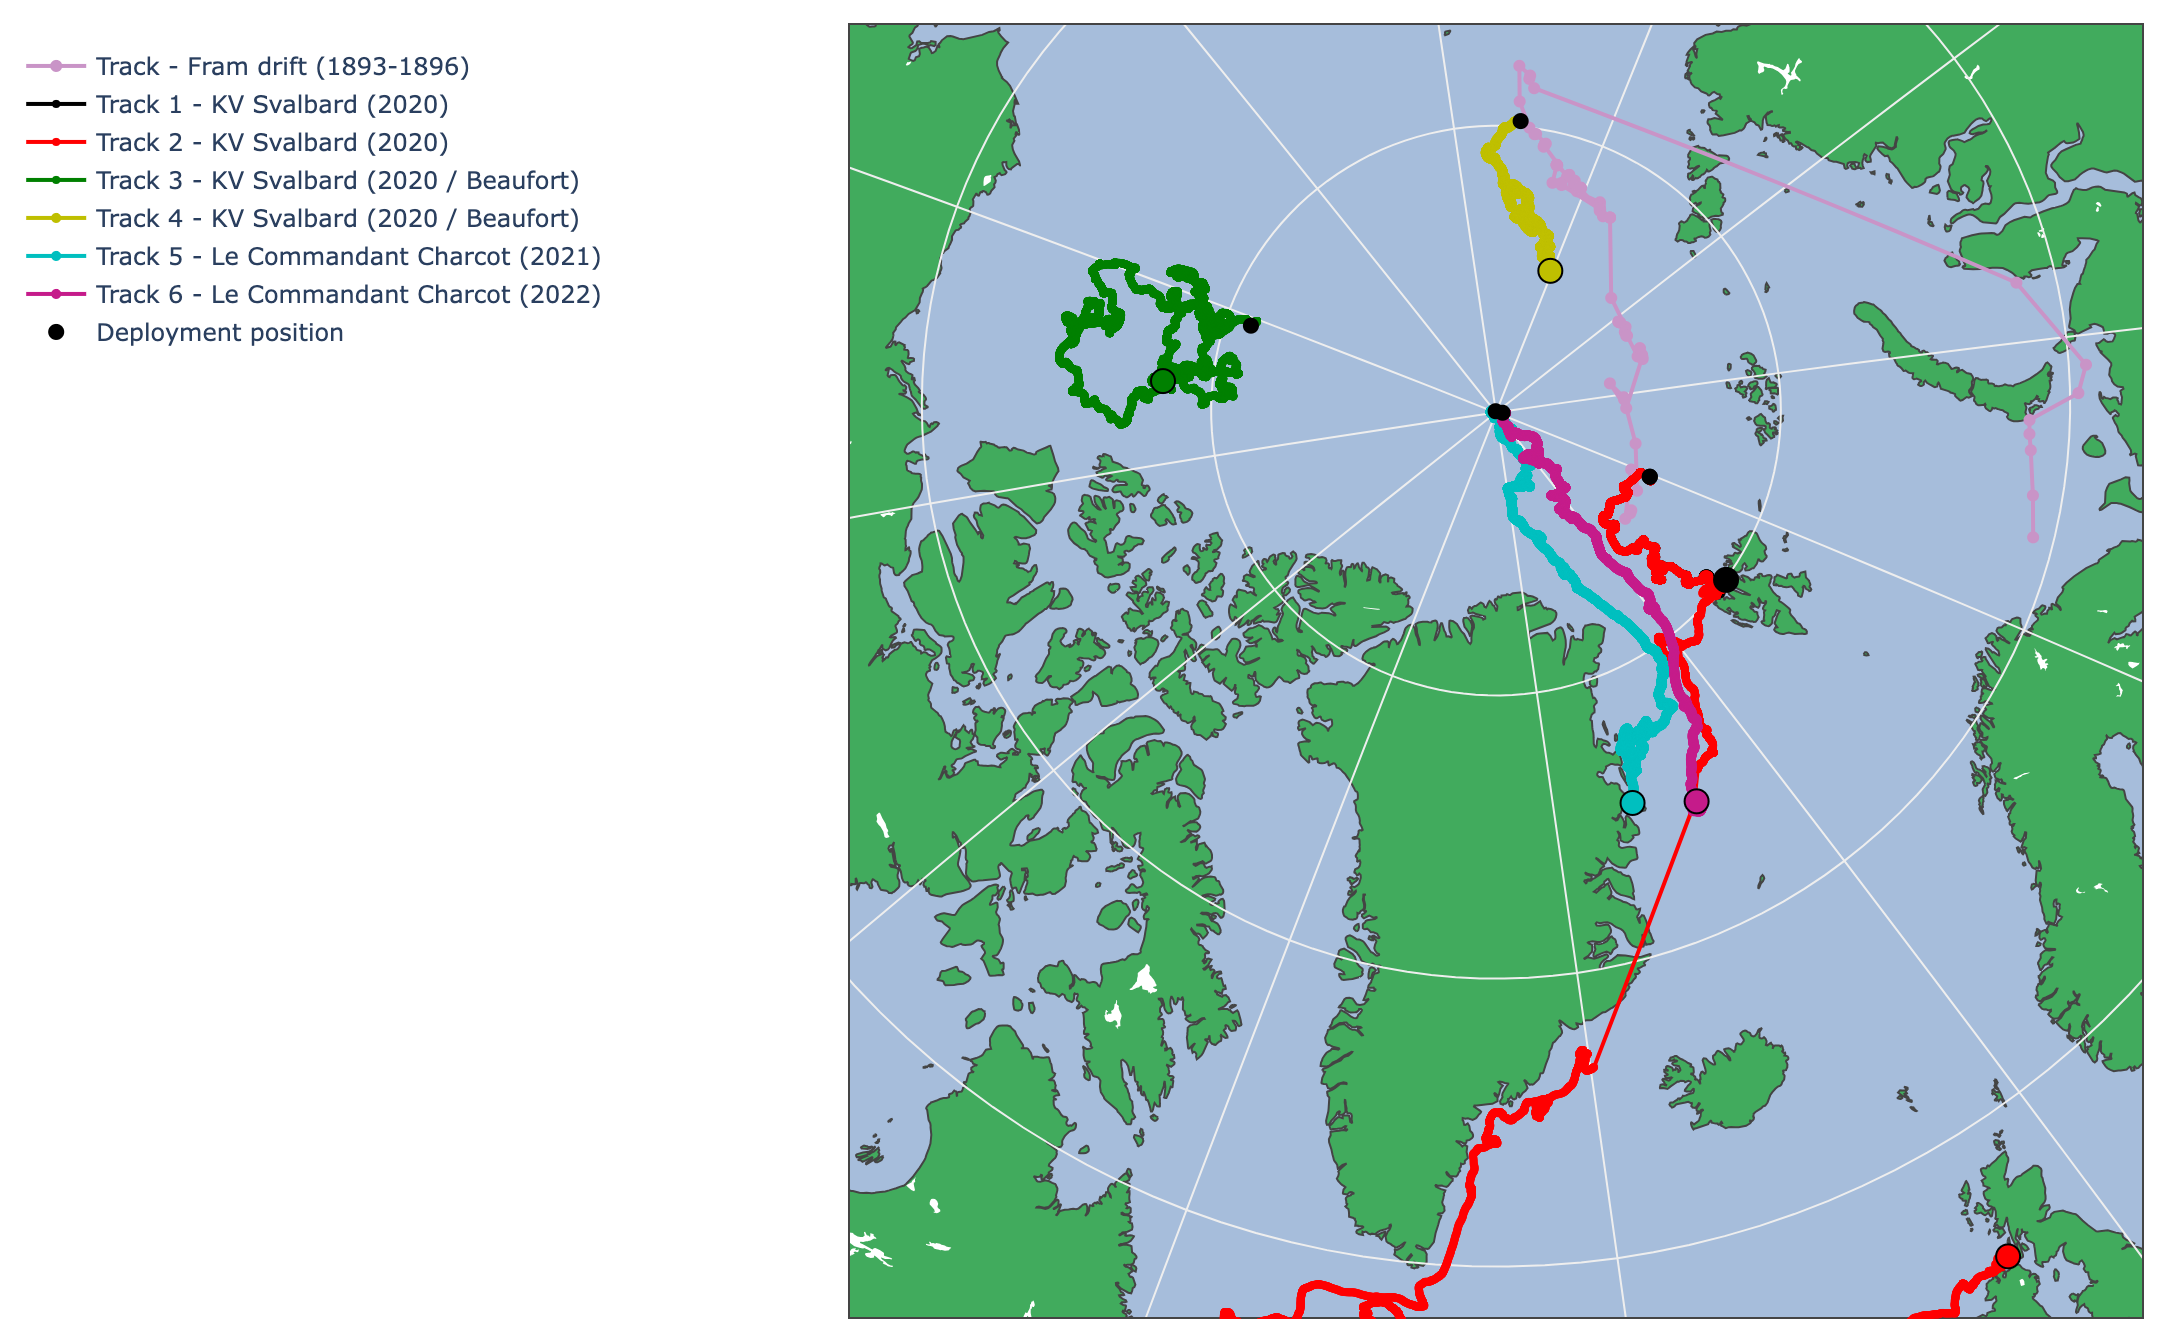
Here is an interactive map you can explore, showing all the buoy tracks. Also: You can see the route Fridtjof Nansen took at the end of the 19th century to prove the transpolar drift. If you don't know about Nansen's expedition read more about it here.
You can zoom in and out with your cursor to get a bigger field of view, and you can add and remove the buoy tracks by clicking on them in the legend. Have fun exploring!
Each buoy track in a single map
Buoy 1 Buoy 2 Buoy 3 Buoy 4 Buoy 5 Buoy 6
The track is coloured depending on the measured surface temperature at each point.
For Buoy 5, we have another type of plot you can look at, it shows the monthly progress drifting southward, see here.